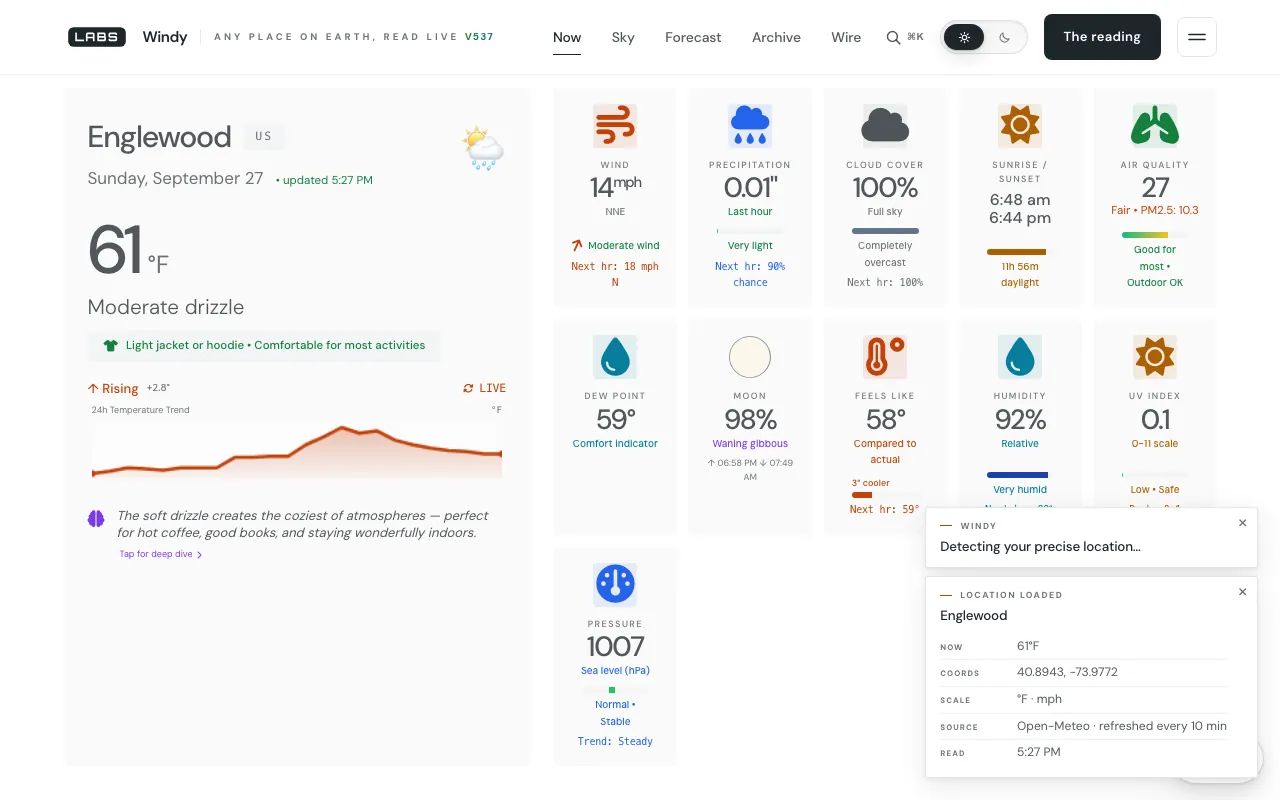
Who it is for
It is for weather watchers, travellers, sailors and gardeners who want today’s outlook, the long record for the same place and the satellite view together, with every source named. It is not Windy.com; that is a separate and far larger service, compared below.
How it works
Each source is fetched directly first. A helper, safeFetch(), falls back to the site’s own relay only if the network or a stale content-security policy blocks the direct call. An older /api/* route, a Netlify convention, returned 404 on Apache and cost every session a wasted round trip, so it is no longer tried first.
Forecasts come from Open-Meteo (the request asks for sixteen daily rows, today included), air quality from Open-Meteo’s air-quality service, and history from Open-Meteo’s ERA5 archive in rungs of 10, 25, 50 and all years. The top rung is worked out from the current year, so it reads 86 years in 2026 and will stay true. Place names come from Open-Meteo, Zippopotam.us and BigDataCloud.
The sky map lazy-loads a self-hosted MapLibre and draws NASA GIBS satellite layers (GOES-East and West, Himawari, VIIRS, IMERG), NOAA radar and lightning, Canadian and German radar, and model wind and pressure from ECMWF, GFS or ICON. Each frame prints its own UTC and local time; an image older than its frame says “held” and by how much, and a step with failed tiles says “partial”. The wire reads the National Hurricane Center’s Atlantic and Eastern Pacific feeds and a newspaper weather feed.
What we tested
All times are UTC on 27 September 2026, measured against a copy of labs.llc build 537 served from our own machine, or against the public source the page itself calls.
- The page, locally200, 96,063 bytes. The scripts, fetched at 20:15:01: windy.js 189,041 bytes and skymap.js 103,757 bytes.
- The forecast direct from Open-Meteo, lower Manhattan200 in 0.40 s: 17.3 °C, wind 20.9 km/h; sixteen daily rows, 27 September to 12 October.
- The same forecast through the site’s relay200 in 0.41 s.
- The ERA5 floor for the same grid cellMaximum on 27 September 1940: 17.1 °C.
Direct and relayed routes answered in about the same time: the relay is a spare, not a toll booth. The old /windy/api/ route could not be tested locally; it relies on an Apache rewrite.
How it compares
We checked each alternative’s own pages on 27 September 2026 and describe only what we saw there. Each gets the pick below when it does the job better.
Windy.com
checked 27 Sep 2026A worldwide interactive forecast map founded in Prague in 2014, carrying global models (GFS, ECMWF, ICON and Meteoblue’s AI model) and regional ones (NAM, HRDPS, AROME), plus radar, satellite and many layers. Its script-drawn page gave our fetch no text, so we checked it through its Wikipedia article and a web search that returned its own pages.
Better at
- Many more models, high-resolution regional ones included, and a model-compare view.
- Far more map layers and a polished worldwide animation.
- Mobile apps.
Where Windy goes further
- The ERA5 record for the same place back to 1940, a click from the forecast.
- Each layer’s source named and each satellite frame’s own time printed, with held or partial frames marked.
- No account and no premium tier; every source it reads is keyless.
National Weather Service (weather.gov)
checked 27 Sep 2026The US government forecast service: local forecasts by city or ZIP, an alerts map, radar, satellite, rivers and rainfall, hurricane, flood and fire-weather products, aviation and marine forecasts, and certified climate data.
Better at
- Official watches, warnings and advisories — the authority the labs console does not replace.
- Human-written local forecasts and specialist aviation, marine and fire products.
- Certified climate records.
Where Windy goes further
- Works for any place on Earth, not only the US.
- Puts a model forecast, air quality, the 1940-onward record and a switchable wind map on one page.
Ventusky
checked 27 Sep 2026An animated weather map with ECMWF, GFS, ICON and GEM models and layers for temperature, precipitation, radar, satellite, wind and gusts, cloud, pressure, CAPE, snow, humidity, sea state and air quality; free, with premium options.
Better at
- More models (it adds GEM) and more layers, including CAPE, snow and sea state.
- Customisable colour scales.
Where Windy goes further
- The long ERA5 record and a plain reading of current conditions beside the map.
- Frame times stated, with gaps marked rather than animated over.
Where it falls short
- Wind is always in mph. The forecast request fixes the wind unit to mph and rainfall to inches, even when the load card says “°C · km/h” in Celsius mode.
- Its charts come from a third-party CDN: Chart.js 4.4.1 from jsDelivr.
- No warnings of its own and no US watch or warning map; the severe wire is NHC tropical feeds plus a newspaper.
- Three global models on the map and no high-resolution regional ones; ICON reaches only five days.
- The name invites confusion with Windy.com.
Which one to pick
| If you need… | Pick |
|---|---|
| Today’s forecast and this date in 1940, side by side | Windy consoleours |
| A satellite and model map with every frame time-stamped | Windy consoleours |
| Is there a warning for my county? | weather.gov |
| Regional high-resolution models, or comparing many models | Windy.com |
| CAPE, snow or sea-state layers | Ventusky |
The fit
Best for
- Seeing how today compares with decades of the same place’s record
- Travellers checking somewhere outside the US
- Anyone who wants to know which source drew which layer
Not for
- Official warnings — use weather.gov
- Metric wind speeds
- Pilots or sailors who need regional high-resolution models
Pick Windy if you want a place’s forecast and its history on one page, with every source named.
Sources for this review
- windy/windy.js in build 537 — units and saved places at lines 8–58, safeFetch() at 185–240, forecast at 580–596, air quality at 1271, archive ladder at 3050–3068, wire at 3297–3299; /assets/js/skymap.js lines 1–45 and 102–104; windy/index.html line 1248
- Windy.com (via Wikipedia and search), weather.gov and Ventusky, checked on 27 September 2026 at about 20:04 UTC